Understanding Phase Response Charts [Part 2]
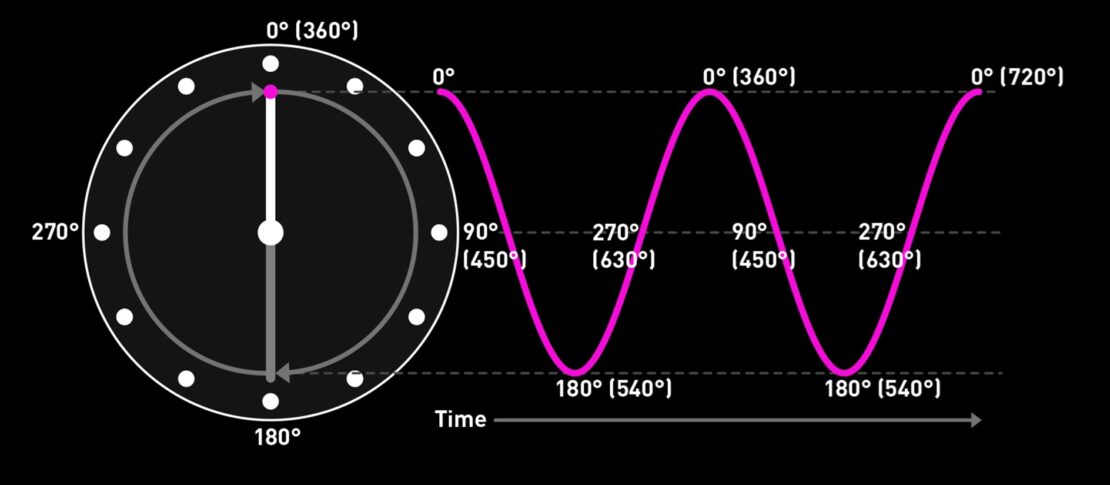
Welcome back to the topic of “Understanding Phase Response Charts”! In Part 1, we determined that phase offers a way to compare and understand the time-domain relationships of cyclical signals without needing to know their exact timing. This is the second and final part, where we’ll discuss why the timing relationship between audio signals matters in studio monitors. Let’s dive right back in!
The electro-mechanical elements that comprise a studio monitor; driver diaphragms and their suspension for example, have mass and compliance (springiness), and the laws of physics that operate in our universe say that when you try and move things that have mass and compliance the movement can’t happen instantaneously. There will always be a time delay; and a change in time means a change in phase. One electro-acoustic example of this is the principle of reflex loading that helps loudspeakers generate low bass.
Reflex loading works by introducing a simple tuned resonance to the combination of enclosure and bass driver. That resonance, created by the mass of air in a tube (the reflex port) bouncing on springiness of the air in the enclosure, effectively reverses the polarity of the acoustic radiation from the back of the bass driver. Reversing the polarity of the back radiation is important because otherwise it would cancel the bass driver’s forward output (which is what happens when a bass driver doesn’t have an enclosure behind it).
But, if you remember the clock face diagram from Part 1, reversing the polarity, so that negative signals become positive, implies a phase change of 180°, and that results in a time delay equivalent to half a full cycle. If the reflex port is tuned to say, 50 Hz, a full cycle (360°) is 1 s/50 = 20 ms, so half a cycle (180°) is 10 ms. Consequently, the low frequency output of that system gets delayed by 10 ms at the port frequency. As an aside, this time delay is one contributor to another technical phenomenon you might occasionally read about in regard to monitors and their low frequency performance: group delay. Group delay effectively describes a monitor’s input to output electro-acoustic latency. Put simply, it is the reverse of time expressed in terms of phase (and mathematically it is the negative slope of the phase frequency response). It is phase expressed as time.
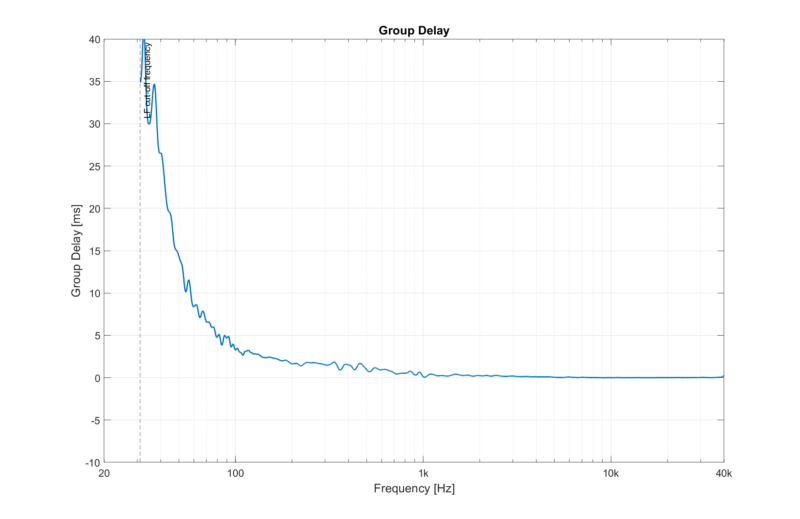
Example of a group delay measurement graph [ADAM Audio A8H 3-way monitor]
Another aspect of studio monitor engineering where the phase plays a vital role is in the acoustic integration of multiple drivers. In the frequency band where, for example, a bass/mid driver is handing-over to a tweeter, the output of the two drivers will overlap. If a crossover frequency is, for example, 3 kHz and the crossover filter slopes are, say, 12 dB/octave, the effective -12 dB overlap band is two octaves wide: 1.5 kHz to 6 kHz. In that overlap band, the acoustic energy arriving at the listener’s ears emanates from two sources (=the two drivers), so their phase relationship is vitally important. We’ve already met the concept of signals cancelling if they are in reverse polarity (180° phase difference) and such cancellation can happen in the crossover overlap band if the phase of the two drivers isn’t carefully managed. Going back to magnitude frequency response curves for a moment, phase errors in the crossover region can cause obvious flaws in the response. The magnitude can fall sharply in the crossover region if the phase of the two drivers is far apart.
The phase change inherent to reflex loading, and the relative phase of multiple drivers, are just two examples of how phase plays a role in monitor performance, however, monitors are full of other electro/mechanical/acoustic phenomena that result in phase changes, and they all vary with frequency. So, in the same way as we can create a magnitude frequency response curve, we can draw a phase frequency response curve and we’ve done that in Diagram 2.
Diagram 2 illustrates both magnitude and phase response curves; magnitude in solid lines (left y-axis scaling) and phase in dotted lines (right y-axis scaling). The monitor in question is a compact three-way system with a bass driver located to the side of a midrange driver and tweeter (it is not an ADAM Audio product but that does not matter for the purpose of this discussion).

Diagram 2: Examples of typical magnitude and phase frequency response curves of a random studio monitor
There are two magnitude curves, the red one showing the frequency response of a monitor captured with a microphone located on the perpendicular axis (on-axis) and the blue one with the microphone moved off to the side somewhat (off-axis). You’ll see that the off-axis curve displays a significant dip in the response through the crossover region between 3 kHz and 6 kHz. This is because when a monitor frequency response is captured at a position away from the perpendicular axis, the relative path lengths from the drivers to the measuring microphone are not the same as they are with an on-axis measurement. Different path lengths mean that the time taken for the two acoustic signals to reach the microphone changes, and consequently, so does their relative phase. The other reduction in level progressively increases above 7 kHz and this to do with directivity which is discussed in this article.
Now, the dotted lines of Diagram 2 show the phase responses for the on and off-axis microphone positions and you’ll see that the dip in the magnitude response between 3 kHz and 6 kHz has an associated change in phase. The driver signals go out of phase at the off-axis position, so their outputs tend to cancel, and that results in a dip in the magnitude response. Conversely, the higher frequency directivity dip mentioned above does not have a significant change in the phase response. The loss in level is simply because the microphone is not on axis anymore so the high frequency level drops.
There’s another interesting feature of Diagram 2 and that’s the falling low frequency phase trend from 20 Hz and 300 Hz. The falling trend reflects a reduction in system group delay with increasing frequency because higher levels of group delay (caused by, among other things, reflex loading) and the large phase changes they imply are primarily a low frequency phenomenon. However, the diagram also reveals a difference between the on-axis and off-axis phase at lower frequencies and that is, once again, caused by a driver to microphone path length change. Moving the measuring position changes its distance to the monitor’s bass driver, and that results in a phase change.
Conclusion
Finally, before we close the lid on phase, there has been, for almost as long as audio systems have existed, earnest discussions among speaker designers, audiophiles and recording engineers regarding the inherent audibility of phase. Do we perceive a subjective influence of phase changes independently of other audio system performance characteristics? The answer is yes, of course we can hear phase, because phase changes imply distortion of a signal in the time domain and if the changes are big enough, the timing errors they would indicate might completely scramble the music; a phase change that effectively delays everything below 300 Hz by one second for example would be certainly audible.
So, the audibility of phase changes depends on their degree, and there is some anecdotal evidence that using DSP within monitors to flatten even a well-behaved phase frequency response can be audible in terms of stereo image focus. But in any case, managing and controlling the phase frequency response of a studio monitor is undoubtedly as important as managing and controlling its magnitude frequency response.
Top Posts
You might like
-
Understanding Frequency Response Charts
Deciding on which studio monitor is likely to suit your needs and work well in your recording space is always best done by listening to a few different models. But pretty much every studio monitor is also accompanied by a technical spec and, if you know how to interpret them,…
-
![Understanding Phase Response Charts [Part 1]](https://www.adam-audio.com/blog/wp-content/uploads/resized/2025/04/adam-audio-blog-learn-understanding-phase-response-charts-thumbnail-300x200-c-default.jpg)
Understanding Phase Response Charts [Part 1]
In a previous blog post we described how to interpret the frequency response curves that often accompany technical specifications of studio monitors. When we talk about frequency response curves, we generally concentrate on what is known technically as the “magnitude frequency response”, however there is another element to a…