Understanding Phase Response Charts [Part 1]
In a previous blog post we described how to interpret the frequency response curves that often accompany technical specifications of studio monitors. When we talk about frequency response curves, we generally concentrate on what is known technically as the “magnitude frequency response”, however there is another element to a loudspeaker’s frequency response that is occasionally spoken of but rarely explained; its “phase frequency response”. So, with this two-part blog post we’re going to explain what phase is, what a studio monitor’s phase frequency response means, and why it is important.
Phase is a somewhat tricky concept and perhaps not entirely straightforward to understand, so the next few paragraphs might need reading a couple of times. Once you’ve understood the concept, however, you’ll almost certainly know significantly more about the complexity of electro-acoustics and studio monitors than any of your friends, so persevere.
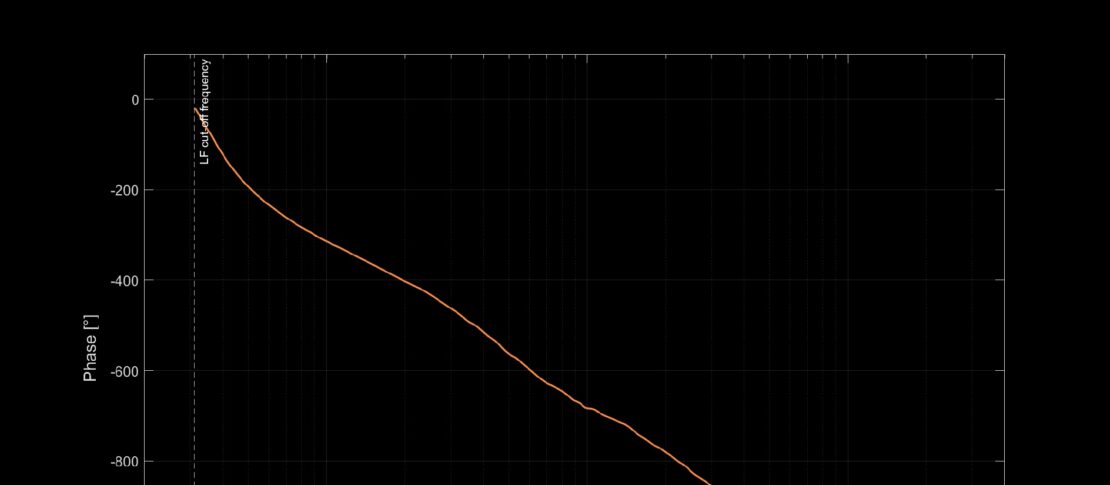
To begin, we’ll go back to the magnitude frequency response curve for a moment. Magnitude defines loudness, so a magnitude frequency response curve describes how loud a speaker will reproduce sound with respect to frequency. Phase however is a parameter that lives in the time domain, so where magnitude defines, “how loud”, phase defines, “when”. But firstly, you’re perhaps wondering, if phase refers to time, why is it expressed in degrees and not seconds, and secondly, the concept of time is meaningless unless it’s referred to a fixed reference (how would you know your age without knowing your date of birth)?
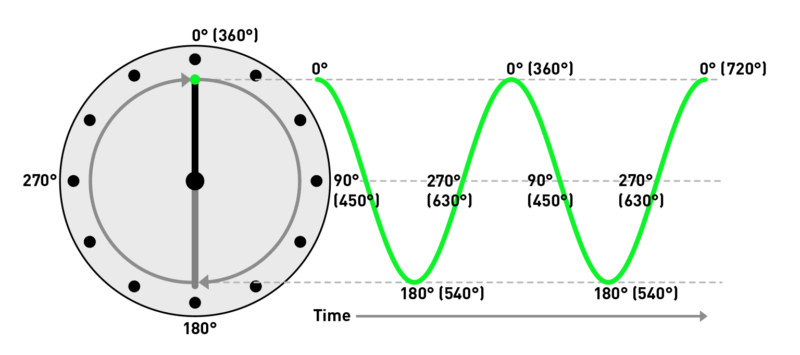
Diagram 1: The clock-face of phase
To begin to build some answers, first imagine a good old clock face. Actually, there’s no need to imagine because we’ve drawn one in Diagram 1. You’ll see that as a clock hand moves once around the clock face to record the passage of time it covers 360 degrees for one rotation of the hand. So there, immediately, is a method of expressing time (12 hours, 60 min or 1 min) in degrees (360°), and it’s a method that is particularly appropriate to describing cyclical phenomena such as music signals. Diagram 1 however doesn’t illustrate just a clock face, it also shows that the vertical position of a point at the end of the clock hand describes a sine wave as it rotates around the face, and that means phase is also encoded in the path of the sine wave (or a wave that defines a music signal). We’ve annotated the clock and the sine wave with phase in degrees to illustrate this.
So, that’s how phase encodes time in a cyclical signal, but why is it more useful than using our more familiar measure of time? Well, in the same way that, without knowing your date of birth you can’t know your age, if an audio signal starts at a nominal zero time and you want to know its characteristics at some time in the future, you need to keep tabs on it for as long as the signal lasts. Phase is more useful because it’s a measure that’s both independent of frequency and doesn’t need a zero time reference. Imagine the clock generated sine wave of Diagram 1 has a frequency of 10 Hz; in which case the hand will race around the clock face ten times every second. That will mean the peaks of the sine wave are 0.1 second, and 360° apart. If however, we speed the clock face so that it turns twenty times every second, the sine wave peaks will be 0.05 seconds apart, and the frequency will be 20 Hz, but the peaks will still be 360° apart.
We have now established that phase provides a method of comparing and relating the time domain relationships of cyclical signals without knowing their absolute time. Hold that last thought until we return to this topic in Part 2 of “Understanding Phase Response Charts”, where we explain a couple of reasons why the time relationship between audio signals is important in studio monitors.
Top Posts
You might like
-
Understanding Frequency Response Charts
Deciding on which studio monitor is likely to suit your needs and work well in your recording space is always best done by listening to a few different models. But pretty much every studio monitor is also accompanied by a technical spec and, if you know how to interpret them,…
-
Understanding Speaker Directivity Charts
Why do studio monitors disperse sound directionally? When we use nearfield monitors in the studio it’s normal to both angle them inwards towards the listening position and make sure they’re not located significantly above or below listening head height. This is because monitors are directional, so we can only expect…